A note on my new job. I’m joining the FinTech startup RevolutionCredit as Chief Scientist. In this role, I’ll work on developing the next generation of credit scoring methodologies in the financial technology and behavioral science field. Applying behavioral science to both (i) identify “upwardly mobile” people: those with characteristics of her significantly higher creditworthiness than their credit score would indicate; and (ii) nudge consumers toward better financial behaviors. The role requires a blend of behavioral economics, statistical analysis and financial capability development. NYCA partners, Lerer Hippaeu Ventures, Omidyar Networks, Accion and several other elite FinTech investors are backers of RevolutionCredit, as they seek to expand financial inclusion and give consumers globally the credit and financial identity they deserve.
Here’s an example of how people’s behavior can be nudged by different approaches. Note: this is not something RevolutionCredit has done, but it gives you a feel for the realm in which the company operates:
What positively affects borrowers’ repeated use of payday loans?
University of Chicago Researchers presented three different types of information to people who had just obtained payday loans.
Actual annual percentage rate (e.g. APR exceeding 400%)
Dollar cost of payday loans over time
Realistic look at how many weeks it would actually take to pay off the loan
Researchers then tracked subsequent payday loan borrowing by the three different groups.
Of the three types of info, borrowers exposed to the actual dollar cost of a payday loan were favorably influenced (‘nudged’). The time it would take to repay also had an effect. The crazy-high APR information? It actually had little to no effect.
The ‘nudged’ borrowers reduced their usage of payday loans (pdf link to study).
These sorts of behavioral insights represent an emerging field, one that has been built on the research of titans such Daniel Kahneman, Amos Tversky and Richard Thaler. Dan Ariely hits on these areas with his Predictably Irrational work. It’s a realm that holds significant benefit to consumers, and to lenders as well.
I will use the R programming language a fair amount in this role. I’ve already done some work with it, as you can see in my recent post analyzing whether the Hot Hand exists in basketball (yes, but it’s rare).
This job reunites me with Zaydoon Munir. He and I worked together at eFinance in the early 2000s. It was there that I built statistically rigorous credit scorecards for eFinance client Hertz Equipment Rental. It took several weeks, and was one of those big projects that was tough, but afterwards is a signature accomplishment you always remember. Some details of the project are in the embedded PDF below.
This new position is certainly a change from what I’ve been working on the past few years (innovation management, social business). It builds on things I’ve done earlier in my career (Bank of America, eFinance). I’m looking forward to diving deep into this role, and helping consumers access opportunities for better financial health.
Want to see something amazing? Take two minutes to watch what Golden State Warriors guard Klay Thompson did in the third quarter of a January 2015 game:
Klay is a great shooter in general, but that performance was unreal. He hit 13 shots in a row, 9 of which were three-pointers. It’s what I characterize as a “Hot Hand”. If you’ve played basketball, you likely understand the Hot Hand. Every shot feels like it’s going in, and it does. You can “feel” the definitive arc to the basket. There’s a hyper confidence in every shot. I like the way Jordan Ellenberg describes it on Deadspin:
The hot hand, after all, isn’t a general tendency for hits to follow hits and misses to follow misses. It’s an evanescent thing, a brief possession by a superior basketball being that inhabits a player’s body for a short glorious interval on the court, giving no warning of its arrival or departure.
The Hot Hand arrives when it damn well chooses, and leaves the same way. Clearly, it had an extended stay with Klay Thompson that night.
But, there is research that dismisses the notion of the Hot Hand. In 1985 Cornell and Stanford researchers – Thomas Gilovich, Robert Vallone, Amos Tversky – conducted an analysis (pdf) of their definition of the Hot Hand. Here’s how they describe a Hot Hand:
First, these terms imply that the probability of a hit should be greater following a hit than following a miss. Second, they imply that the number of streaks of successive hits or misses should exceed the number produced by a chance process with a constant hit rate [i.e. field goal percentage].
They also polled fans, and got these responses:
The fans were asked to consider a hypothetical player who shoots 50% from the field. Their average estimate of his field goal percentage was 61% “after having just made a shot,” and 42% “after having just missed a shot.” Moreover, the former estimate was greater than or equal to the latter for every respondent.
Their research, some of which is replicated below for analyzing Klay Thompson, showed that the belief in the Hot Hand is misguided. The streaks of made shots by players are all part of the normal distribution of shots one would expect statistically.
Oh, but that Klay Thompson quarter…! Let’s look at Klay Thompson’s performance to see if he really did have a Hot Hand.
Klay’s shooting history
To analyze Klay’s performance, we need data. Fortunately, the NBA provide handy stats on its players. I was able to get two seasons (2013-14, 2014-15) of shooting data for Thompson. The data includes the game, shot sequence, shot distance and whether the shot was made or not.
Klay is a 45.4% shooter from 2013-2015, taking 2,514 shots in 157 regular season games. I wanted to get a sense of how he shoots from different ranges, so I categorized his shots in four buckets:
Short: < 9 ft
Midshort: 9 – 16 ft
Midlong: 16 – 23.7
Long: >= 23.7 ft
With the ranges, we gain some insights about how Klay operates:
You can see in the left chart that he prefers longer shots. However, his shooting percentage is significantly better for close-in shots. Because of the marked difference between his short range shooting (55.7%) and the other distances, I’m going to remove shots taken from less than 9 feet away. Making close-range shots (e.g. layups) is not an example of a Hot Hand; that designation is reserved for longer shots.
Geeking out
You can see the data files on Github: 2013-14, 2014-15. They were combined to do the analysis. This R function categorizes the shots according to their distance.
Comparing Klay against the researchers’ definition of Hot Hand
Let’s look at a couple aspects of Klay’s performance vis-a-vis the analytical framework of the Cornell and Stanford researchers.
First, they looked at what happens after a player makes a shot. Did they have a higher shooting percentage after a made shot? In a modified version of this test, I looked at the set of longer shots that were taken consecutively. If there was a tendency to shoot higher percentages after a made shot, there must be a corollary lower shooting percentage after missed shots.
This table shows the longer shot FG% in aggregate for Klay Thompson after (i) made longer shots; (ii) missed longer shots; and (iii) when he hasn’t taken a prior longer shot. That third (iii) scenario includes both the first shot of a game, and cases where he shot a short ( < 9 ft) basket prior to taking a longer shot.
Scenario
FG%
When Klay makes a shot, the FG% on his next shot is…
43.2%
When Klay misses a shot, the FG% on his next shot is…
42.5%
When Klay hasn’t taken a prior longer shot, the FG% on his shot is…
41.3%
His overall FG% for longer shots (>= 9 feet) is…
42.4%
Looking at the table, what do you notice? His highest field goal percentage occurs after a made shot! Does that validate the belief that shooters “get hot” after making a shot? Unfortunately, no. Statistical analysis dismisses that possibility; which if we’re honest with ourselves, is the right call. There’s not enough of a difference in FG% after a made shot. This is consistent with the Cornell and Stanford researchers’ findings.
Next, there’s the question of whether Klay’s individual shots show any kind of pattern that’s not random. As an example, look at the graph of makes and misses for his first 100 longer (>= 9 ft) shots of the 2014-15 season:
You can see there are a number of runs in there. For instance, shots 12 – 19 are all misses, followed by shots 20 – 23, which are all makes. Maybe Klay’s shooting does exhibit a pattern misses-follow-misses, and makes-follow-makes? Turns out…no. Statistical analysis shows that the patterns of makes and misses are entirely random. This is consistent with the findings of the Cornell and Stanford researchers.
Finally, we look at an analysis that the researchers did on some NBA players back in 1985. They broke up the players’ shooting histories into sets of four shots. They then looked at each set of four shots. They wanted to see if there were higher frequencies of 3 or 4 made shots per set, as well as higher frequencies of 0 and 1 missed shot per set, than one would expect to happen normally. If so, that would indicate “streakiness” (i.e. evidence of Hot Hand).
I’ve run that analysis for Klay’s two seasons below:
0 made
1 made
2 made
3 made
4 made
Actual
55
152
184
77
18
Expected
54
158
174
85
16
As you see, Klay’s actual “made” frequencies are close to what would have been expected. Statistical analysis confirms: there is no unexpected streakiness in his shooting. This is consistent with the findings of the Cornell and Stanford researchers.
At this point, maybe the researchers were right! Klay hasn’t shown any evidence of a Hot Hand.
Geeking out
Prior shot analysis: For the prior shot analysis, I looked at only longer shots (i.e. >= 9 ft). But I also wanted them to be actual prior-next pairs of shots. That means I didn’t want the analyze the impact of a prior short shot on a subsequent longer shot. To keep the data set focused only on consecutive longer shots, I wrote this R program.
Both the prior shot and the next shot were coded as 0 (miss) and made (1). These values were aggregated into a 2×2 table:
next miss (0)
next make (1)
prior miss (0)
436
366
prior make (1)
322
278
A Fisher’s exact test was then run on the table. The p-value is 0.8285. The null hypothesis that the next misses and makes are not correlated to prior misses and makes is accepted.
Runs of makes and misses: The entire sequence of 1,945 longer shots over two seasons were subjected to a test of randomness. I held off breaking the sequences into individual games, believing that such extra work would not yield materially different results. The specific test of randomness was the Bartels Ratio Test (background here) in R. The null hypothesis of randomness is accepted with a p-value of 0.9935.
Sets of four shots: For the actual number of made shots per set, first I broke the two seasons of Klay’s shots into 486 groups of four, via this R program. I then aggregated these into a table. For the expected number of made shots for 486 simulated groups of four, I created a binomial tree. The tree took Klay’s longer shot FG% for its probabilities: make @ 42.365%, miss @ 57.635%.
The actual numbers of made shots per set (i.e. 0 – 4) were compared to the expected number with simple correlation. The correlation coefficient is .99, with a p-value of 0.0005. The null hypothesis that the numbers aren’t covariant is rejected. Which in this case, means Klay’s sets of four didn’t show any unexpected variances (i.e. concentrations of makes and misses).
Evidence for Klay’s Hot Hand
OK, I’ve managed to show that Klay Thompson’s performance matches the results found by researchers Gilovich, Vallone and Tversky. But we saw what he did in that third quarter. Excluding the two short shots from that third quarter, Klay made 11 shots in a row. He was shooting out of his mind. What says that was evidence of a Hot Hand?
We can start by assessing the probability of hitting 11 longer shots in a row. As an example of how to do this, consider the coin flip. 50/50 odds of heads or tails. What are the odds of getting 3 heads in a row? You multiply the .5 probability three times: 12.5% probability of three heads in a row.
Klay’s FG% for longer shots is 42.4%. Let’s see what the probability of 11 made shots in a row is:
0.424 ^ 11 = 0.00789%.
Whoa! Talk about small odds. Over the course of Klay’s two seasons, he had roughly 177 sets of 11 shots. The expected number of times he’d make all 11 shots in a set is: 0.00789% of 177 = 0.013 times. Or looked at another way, we’d expect 1 such streak for every 12,674 sets of 11 shots, or 140,404 shots! Klay would need to play 144 years to shoot that many times.
Next, let’s look at the streaks Klay actually had over the two seasons:
The most common streak (292 of them) is 1 basket, which may violate your sense of a “streak”. But it’s important to measure all the intervals of streaks, including those with only 1 basket.
At the other end of the spectrum, look at that 11-shot streak. It really stands out for a couple reasons:
There’s only one of them. It’s very rare to hit 11 longer shots in a row.
There’s a yawning gap from the next longest streak, 7 shots. There was only 1 seven-shot streak as well.
When Klay starts a new streak (i.e. hits an initial longer basket), his average streak is 1.68 made shots in a row. I ran a separate statistical analysis from the 11 “coin flips” example above. Using his average of 1.68 streaks, the odds that he would hit 11 in a row are 0.0000226%. This ridiculously low probability complements the “coin flips” probability described above of 0.00789%.
Using either number, the point is this:
Klay’s streak of 11 made shots is statistically not supposed to happen. The fact that he had an 11-shot streak cannot be explained by normal chance. Something else was at work. This is the Hot Hand.
It is true that Hot Hands are rarer than fans think. Much of Klay’s shooting history validates the findings of the Cornell and Stanford researchers. But it is undeniable that Klay did have a Hot Hand in the third quarter of the January 2015 game.
To determine the number of streaks, I wrote an R program. The program looks at streaks only within games. There’s no credit for streaks that span from the end of one game to the start of the next game.
On a regular X-Y graph, the distribution of streaks is strongly right-skewed. Rather than use normal distribution analysis, I assumed a Poisson distribution. Poisson is most commonly used for analyzing events-per-unit-of-time; the unit of time is the interval. However, Poisson can be applied beyond time-based intervals. I treated each streak as its own interval. I then used the average number of shots per streak – 1.68 – as my lambda value. To get the probability of 11 shots in a streak, I ran this function in R: ppois(11, lambda = 1.68, lower = FALSE).
Take a look at your organization’s innovation projects. Are you strategically balancing your efforts between the core business and future growth areas?
In advising companies about innovation, an area I stress is the value of consciously pursuing both little and BIG innovation. Often, companies pursuing innovation can be categorized as either:
Seeking small innovations such as operational improvements and existing product enhancements
Swinging for the fences to find unique, breakthrough ideas in new markets
In both cases, such myopia limits the value of innovation, focusing too low (incrementalism) or too high (core business withers from neglect). Companies do well to take a holistic look at their innovation efforts, understanding their portfolio of initiatives in the context of both small and big projects.
To understand the value of this approach, let’s examine Amazon’s innovation portfolio. Why? Their efforts are visible, and they’ve got the results to back up their innovation approach:
Amazon’s stock performance is no fluke. They’ve done a fabulous job mixing their innovation efforts. They have significantly improved their core, while moving into adjacent and unfamiliar ground.
Segmenting Innovation Efforts
To begin with, it’s useful to divide innovation efforts according to their level of familiarity:
Why use familiarity as the basis of segmenting? Because familiarity manifests itself in two ways when it comes to innovation:
Institutional advantage: Companies are awash in information about current operations. Product or service features, with their strengths and weaknesses, are understood. How they’re delivered is understood. What customers like and what they want to see improved…are understood. This data rich environment makes it easier to focus on what is done today.
Personal advantage: Expertise in a given realm is why you hold your position. Executing on various initiatives related to current operations is how you’re assessed. Keeping your focus on that is a natural outcome, but one that can stymie interest in exploring new areas.
Moving outside the realm of familiarity is tough. Yet that’s where growth for the company will be found. So it takes a conscious effort to step outside the world we know, assess opportunities and try new things. Much of the organization is not geared to do this.
The matrix above characterizes innovation efforts as three types:
Sustain: Innovations that maintain and even grow the core business. While this type of innovation is often dismissed as inconsequential, that;s not true at all. We’ll see that in a moment with amazon.
Expand: Innovations that are adjacent to an organization’s current operations. That can be extending current offerings into new markets, or introducing new products and services to existing customers.
Transform: Innovations here have the effect of changing the identity of the company. To be successful in these new markets, the new offerings are substantially better at satisfying existing jobs-to-be-done for customers.
To show the diversity and power of innovations representing each of these types, let’s look at how Amazon’s innovation have fit this model.
Amazon Innovations by Type
One of the more valuable aspects of the Amazon story is that it highlights the value of innovating for core operations as well as entering new arenas. The matrix below maps several Amazon innovations against the different types:
Sustain
Think sustaining innovation can’t make a difference? Then check out Amazon’s results here.
Collaborative filtering recommendations are those suggested products that display when you’re viewing an item. Collaborative filtering is based on product categories and “people who bought this also bought that”. At one point in Amazon’s history, its recommendation engine was responsible for 35% of company revenues.
1-click checkout is Amazon’s patented innovation that dramatically reduce friction in the buying process. With a single click, your purchase is on its way. This is a significant improvement over the multi-field (even multi-page) process that other sites provided to purchase.
Drone delivery is a futuristic idea: have drones deliver goods within 30 minutes. Bypass the traffic on the roads. Even if it is of dubious potential, it’s a good example where sustaining innovations can be “radical” in the popular sense.
Prime originated as a way for customers to pay a single price for all-you-can-buy shipping. Customers were already paying for shipping on a per order basis; Prime made the shipping a single price, no matter how many transactions. As a sustaining innovation, it has delivered impressive results. Prime members are estimated to spend $1,500 per year vs. $625 for non-Prime customers.
Expand
The two flavors of expansion innovation vary in emphasis: new products and services vs. new customers. But they both are cases of extending what the company already does. The familiarity measure is less, but still meaningful.
Affiliate marketing is a normal web practice now. But Amazon was an early innovator here, although not the first. Through affiliate marketing, Amazon reached new customers with its existing offerings.
Kindle is Amazon’s reading tablet. People who own Kindles download the digital books, and are able to search text and annotate passages. Kindle was estimated to account for 10% of Amazon’s sales in 2012.
Amazon Fresh is a home delivery service for groceries. More than a decade after the failure of Webvan, Amazon is seeking to deliver a new category to customers: perishable groceries. This extends the offerings of Amazon’s existing retail selection, for both existing and new customers.
Transform
Amazon’s growth has included investing in transformative innovation, beyond its initial core business. The risk here is much higher, as the company moves beyond the familiarity of its core business and takes on new competitors.
Amazon Web Services offers cloud computing services to companies. Its origins come out of Amazon’s work to optimize its internal cloud operations. Jeff Bezos decided to turn that work into a new offering. Introduced in 2006, AWS has been a tremendous success. In the 2nd quarter of 2015, AWS generated a profit of $391 million on $1.82 billion in revenue. Even the super secret CIA is using AWS.
Prime is now Amazon’s vehicle for delivering original content programming. While its roots were in making buying products easier, Prime has become a wide range of offers. One of these is Amazon’s entry into the world of original programming, Amazon Studios. Its shows include Alpha House, Betas and Bosch. Oh, and these new content customers are converting to full Prime shoppers.
Fire Phone was Amazon’s entry into the smart phone market, taking on Apple’s iPhone, Samsung’s mobile phones and others. Fire Phone’s notable feature was its 3-D “Dynamic Perspective”. However, it failed to offer anything that delivered better outcomes on people’s jobs-to-be-done. Amazon has stopped its work on the Fire Phone.
Amazon: What a Strategic Innovation Portfolio Looks Like
Amazon provides a powerful example of how companies should approach their innovation portfolios. Despite claims that sustaining innovations are a recipe for mediocrity, Amazon has shown there’s plenty of value innovating on your core. What aids Amazon in this case is a clear mission, a sense of what they want to accomplish and a CEO who continually acts on it. Lack of such clarity and leadership is the cause of innovation failure for other companies; it’s not “getting bogged down in incremental innovation”. Note that Google also dedicates significant innovation effort towards its core business.
In the Transform quadrant, Amazon takes on bigger risks. This is the harder area. AWS has turned out to be a hit. Fire Phone was a failure. But the key is (i) understanding the risks of that quadrant; and (ii) making sure efforts there are part of a larger portfolio approach across different levels of familiarity.
What’s the right mix? That will vary by company and the health of its core business. The key is to understand why you’re making the innovation investments you are.
In a recent PwC survey, 61% of CEOs said innovation was a key priority for their company (pdf). The only surprising result there is that it wasn’t 100%. Innovation efforts come in a variety of forms: innovation and design labs, jobs-to-be-done analysis, corporate venturing, distributed employee experiments, open innovation, TRIZ, etc.
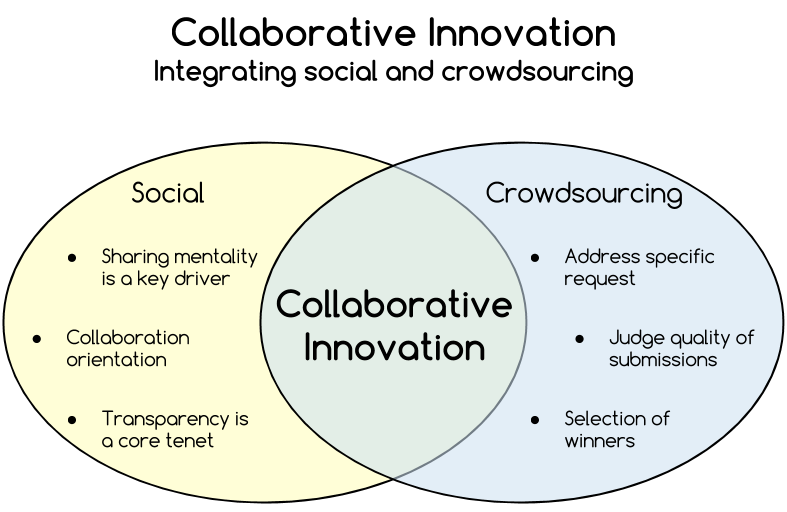
In this post, I want to focus on another type of innovation initiative: Collaborative Innovation. A good way to think about Collaborative Innovation is that it integrates social and crowdsourcing principles:
A definition I use for this approach:
Collaborative Innovation is defined as activities organizations use to improve their rates of innovation and problem solving by more effectively leveraging the diverse ideas and insights of employees, customers and partners.
While it seems straightforward, Collaborative Innovation is actually a fairly sophisticated activity. People with a cursory understanding say all you need to do is: (i) stand up an ideas portal; (ii) let people post ideas; (iii) collect votes on those ideas; and (iv) pick the winners.
Unfortunately, that’s just plain wrong. I’ve seen too many cases where organizations launch idea portals, only to see them die off six months later. The practice of Collaborative Innovation is a rich realm, with solid results for those who apply it thoughtfully.
This post is a look at several key metrics that corporate innovation teams should focus on as they lead Collaborative Innovation programs. The metrics are segmented by the different phases of innovation:
Sourcing
Decisioning
Acting
The metrics below rest on two key assumptions: use of an innovation management software platform; use of campaigns to target innovation efforts.
Sourcing
Sourcing refers to the generation of ideas, as well as eliciting others’ insights about an idea.
Phase objectives
Distinct, differentiated ideas
Ideas matching needs of customers (incl. internal customers)
Ideas matching the innovation appetite of the organization
Capturing the cognitive diversity of participants
Growing the culture of innovation
Metrics
Metric
Description
Why
Trend in unique logins
Measure the ratio of logins/invited over time for multiple campaigns. Want to see a rise over time until reaching a steady state (~60%).
No logins, no ideas
Confirm that the credibility of program increasing
Demonstrate better targeting of relevant innovation topics
Trend in multiple logins
Determine the number of people who log in to each campaign 3 times or more. Divide these multi-login people by the total number of people logging in to each campaign. Look for increasing ratios over time.
Returning to a campaign repeatedly is a measure of engagement
More repeat logins increases opportunities for collaboration
Ratio of ideators to unique logins
Divide the number of people who post at least one idea by the number of unique logins. Want to see a rise over time until reaching a steady state (10 – 15%).
Ensure those with valuable ideas are being invited
Track whether the campaign questions are accessible to those invited
Confirm credibility of the program is increasing
Average number comments per idea
Divide the number of comments by the number of ideas, per campaign. Target an average of 2 comments per idea.
Ideas are the start, but need others’ insights to evolve and grow
Track the collaboration culture of the organization, and of specific org units
Ensure participants understand that more than ideas are desired
Average number of replies per comment
Divide the number of comment replies by the number of comments. Target an average of 0.5 replies per comment.
Innovation dialogues are healthy for both ideas and the organization’s innovation culture
Sharing of insights among employees is a second level objective, and this helps track that
Average number of votes per idea
Divide the number of votes by the number of ideas, per campaign. Target an average of 3 votes per idea.
Participants can help identify ideas with greater potential
Ensure the voice of the community is captured, to complement the views of experts and campaign sponsors
Unique org units | departments | locations contributing
Count the number of different org units, departments and/or locations with at least one person posting an idea, posting a comment or voting. This count needs to be considered against the number of org units, departments or locations invited.
Seek inputs from people who normally aren’t working closely together, to ensure different perspectives are brought into the campaign
Decisioning
Decisioning refers to identifying which ideas move forward for next steps. This phase is the bridge between getting a lot of different ideas, and determining which ones will be acted on.
Phase objectives
Identify ideas presenting enough possibility to warrant further review
Acknowledge value of community’s perspective
Timely assessments of ideas
Metrics
Metric
Description
Why
Ratio of ideas selected for further review
Some number of ideas submitted for each campaign will be selected for the next round of review. Calculate the ratio of selected ideas to total ideas submitted. Watch how this ratio changes over time.
Track whether campaigns are generating the level of possibilities expected
Look for cases of being overly pessimistic on ideas’ possibilities (too-low or declining ratio over time)
Ratio of top 5 voted/commented ideas selected for further review
Of the ideas that were the top 5 for either votes or number of unique commenters, track how many were selected for further review.
When the community is invited to comment and vote, they have a natural expectation that their interactions will be part of the decision calculus
Failure to regularly consider what the community coalesces around will reduce enthusiasm to participate
Percentage of initially reviewed ideas sent back for iteration & information
Of the ideas that were selected for further assessment, track the number where the idea submitter (and team) are asked to iterate the idea and/or provide more information.
Ideas rarely have enough “meat” on their initial sourcing, and benefit from further development
Watch out for too conservative a mindset by those making decisions on ideas; are they too quick to say ‘no’ without seeking more information?
Time to complete decisions
Measure the time between selection of ideas for further review and selection of ideas to move forward into the Acting phase. The time will vary by the level of risk attendant to a campaign.
Participants will have a reasonable expectation that promising ideas move forward; delays signal a lack of commitment
From the world of finance, the time value of money argues for moving sooner rather than later on ideas with value
Ratio of reviewed ideas that advance to Acting phase
Divide the number of ideas selected to move into the Acting phase by the number of ideas selected for review. Watch this ratio over time.
Moving ideas forward to action is core to developing an innovation culture; ensure this key step is occurring as expected
Too-low or declining ratios indicate a breakdown in the innovation process
Ideas that move forward are critical for ensuring the credibility of the innovation effort
Acting
Acting refers to the activities to prove out an idea, develop it and prepare it for full launch. Or to learn why an idea won’t be feasible, ultimately.
Phase objectives
Develop deeper understanding for whether the idea passes the three jobs-to-be-done tests that determine market adoption
Optimize features that best deliver on the outcomes that the idea’s targeted beneficiaries have
Maximize the probability of success by eliminating ideas that just aren’t working
Metrics
Metric
Description
Why
Average number of experiments per idea
Tally the total number of experiments for a “class” of selected ideas for Acting phase, calculate the average per idea.
Because of the inherent risk of trying something new, many ideas need different looks
Learning mentality to understand an idea’s strengths and weaknesses
Valuable for establishing a strong innovation culture for the organization
Time to make final decision on selected ideas
Track the amount of time between the decision to put an idea into the Acting phase, and the decision whether to pursue the idea at scale.
While this process shouldn’t be rushed, it should be treated with appropriate diligence
Participants will expect final decisions; failure to do so undermines the program credibility
Ratio of ideas selected for full launch
Divide the number of ideas selected for full launch by the number of ideas selected for the Acting phase. Watch how this ratio tracks over time.
The determinant of success for this phase is the number of ideas that make to full launch
Ideas in this phase passed muster during the prior Deciding phase; the percentage that make it to full launch should be high
Projected and realized value of ideas that have been moved to full launch
Aggregate projected and realized value of the ideas that will be or have been put into full launch.
The bottom line rationale for the innovation program
Critical for establishing credibility of the program with senior executives
The above list is solid foundation of metrics to track for your Collaborative Innovation program. It’s not exhaustive. And there are likely elements for each phase that will vary for each organization.
But these are good for watching how your program is tracking. Behind each metric, there are techniques to enhance outcomes. The key is knowing where to look.
When trying to solve a challenge, what is the probability that any one person will have the best solution for it? It’s a simple mathematical reality: the odds of any single person providing the top answer are low.
How do we get around this? Partly by more participants; increased shots on goal. But even more important is diversity of thinking. People contributing based on their diverse cognitive toolkits
Cognitive diversity is a vital contributor to innovation. Bringing together people who have different expertise, heuristics and perspectives to solve problems has shown value time and again. Professor Scott Page’s The Difference is a terrific book outlining the frameworks and value of cognitive diversity.
I thought it would be useful to collect some cases that highlight the value of cognitive diversity. The theories are powerful, but we respond strongly to specific examples. Collected below are ten cases of where cognitive diversity has shown its value. Feel free to use them for your own work as needed.
1. The mystery of our kidney tubules
Problem: Human kidneys have tubules. For years, they were assumed to be leftover, useless artifacts of our natural evolution. Hence physiologists assumed they had no purpose. Meaning their care and study could be safely ignored.
How diversity helped: One day, an engineer looked at the loops. He saw something different. He realized they were actually part of something called a countercurrent multiplier. These mechanisms concentrate liquids in a system. Suddenly, tubules were no longer evolution’s leftover junk. They were seen for what they were: vital parts of our kidneys’ operations.
An engineer with no special biological expertise saw things in a total different way.
2. Why this particular pathology in a drug discovery trial?
Problem: A pharmaceutical company’s R&D group was conducting a discovery study for a new drug. They couldn’t understand the toxicological significance of a particular observed pathology. They consulted with multiple experts in toxicology, but none could answer the question.
How diversity helped: The pharma firm then ran a crowdsourcing campaign, and within a few the mystery was solved. The solver? A woman with a PhD in protein crystallography using methods common in her field. An area unrelated to toxicology.
The woman with the PhD brought a completely different perspective to solving the problem.
3. Who has a higher probability to solve a problem?
Problem: People with expertise in a particular domain are challenged to provide workable solutions to tough problems. But these are the ones we regularly turn to for help.
How diversity helped: Researchers analyzed the outcomes of InnoCentive’s crowdsourcing challenges. What they found was surprising. For each challenge, they identified the domain of the problem. They then looked at the winning solvers. What were their domains of expertise? They found that people whose domain of expertise was six degrees away from the domain of the problem were three times likelier to solve the problem.
Getting people who are outside the domain of the problem provides higher odds of finding the best solution to a problem.
Problem: In the process of cutting diamonds, new fractures are introduced into the diamond. These fractures don’t show up until the diamond is in use. Manufacturers wanted to split diamonds along their natural fractures without creating new ones. But didn’t know how.
How diversity helped: This is a case of investigators consciously looking at different realms to find a solution, applying the TRIZ method. The solution came in an area quite different than diamonds: green peppers. Food companies need to split the peppers and remove their seeds. Peppers are placed in a chamber to which air pressure is increased significantly. The peppers shrink and fracture at the stem. Then the pressure is rapidly dropped causing them to burst at the weakest point and the seed pod to be ejected. A similar technique applied to diamond cutting resulted in the crystals splitting along their natural fracture lines with no additional damage.
This is an example of consciously seeking solutions outside the domain of the problem. Which is the crux of cognitive diversity.
Problem: Surgery exposes patients to infections, even with all the efforts to maintain a clean surgical environment. Reducing these infections would result in better outcomes for patients.
How diversity helped: 3M brought together people from three different areas: an expert in wound healing; an animal surgeon; and a specialist in theatrical makeup with expertise in adhering materials to skin. They developed a breakthrough product to prevent surgical infections.
While the wound specialist is consistent with what we’d expect, the makeup artist inclusion was quite different. She brought a particular expertise that turned out to be relevant to solving the problem.
Problem: Homelessness has proven to be an intractable, chronic issue for cities. Municipalities spend money on treatment, overnight shelter, food. But the issue has vexed city officials everywhere.
How diversity helped: Sam Tsemberis is a psychologist. His training was to treat the mental health of people. He took a job to treat homeless people in the early 1990s. Not to solve homelessness, with its complex set of causes. Just to treat individuals, which fit his expertise. However, he saw things differently with the homeless. They operated in a set of complex circumstances. He felt the dominant thinking of experts in the homeless field was wrong, that homeless people are quite resourceful.
Lacking any prior experience in solving the homeless issue, Tsemberis assembled a team of people who also lacked any experience in addressing homelessness at scale. One was a recovering heroin addict. Another was a formerly homeless person. Another was a psychologist. And the last, Hilary Melton, was a poet and a survivor of incest.
Their solution? Giving permanent housing to the homeless. And it has proven remarkably successful thus far. Utah employed the method, and eliminated homelessness. Phoenix applied it and eliminated chronic homelessness among veterans.
Fresh eyes came up with a solution that challenged the dominant thinking in the field.
Problem: When in space, astronauts are at risk from solar particle storms. Knowing when these storms are going to happen is important for their safety. However, NASA had spent 30 years unsuccessfully trying to figure out how to predict these storms.
How diversity helped: NASA cast a challenge on InnoCentive, exposing the problem to much broader types of expertise. And they received a solution much better than anything they had ever developed. A retired telecommunications engineer in New Hampshire saw the issue as one involved magnetic coupling between the sun and the Earth.
The solver was not in the space field. He had no connection to NASA. He was located far from NASA operations. His fresh perspective brought new insight to the problem.
Problem: What is the ‘look’ of success in start-ups? Certainly understanding these characteristics could go a long way toward identifying promising ventures.
How diversity helped: Shasta Ventures ran an analysis of 32 companies that are high flyers, including Uber, Twitter, Dropbox, Twitch, etc. They looked at the companies way back when they were raising their Series A. They found a few different traits. One that stands out:
Three-out-of-four of the companies in our survey were built and run by people who were doing it for the first time. They did not have a win under their belt or deep experience in their field, but were passionate about their product and had a unique perspective on how to serve their target customer. Having a fresh perspective is important in tackling a category as people with industry experience are often constrained by what is ‘not possible’ and why it ‘won’t work’.
Shasta notes here what others have found. People get stuck in knowing what they know. Innovation benefits from fresh perspectives.
9. Stopping a key enzyme that powers the AIDS virus
Problem: For a decade, scientists have tried to understand the structure of an enzyme that is critical to reproduction of the AIDS virus. If they could finally figure out the structure, that would allow them to develop drugs to fight AIDS.
How diversity helped: Researchers added the AIDS reproduction enzyme structure to the online game FoldIt. In FoldIt, players try their hand at folding various proteins. Proteins are core building blocks, and they fold in very specific ways. Scientists have a hard time replicating the folding sequence; researchers started FoldIt to see how amateurs could do at replicating the folding.
In this case, insights about the enzyme’s folding were provided by FoldIt gamers (not scientific experts) within three weeks. Their strategies were instrumental in helping scientists to understand the enzyme, and initiate work to neutralize it.
Problem: Music producers spent significant time putting together music from multiple takes. The process was laborious, but needed to ensure high quality recordings for release. Humans inevitably had inconsistencies, either in voice or instruments.
How diversity helped: Exxon engineer Andy Hildebrand had spent 18 years working in seismic data exploration. He developed a technique using a mathematical model called autocorrelation. His approach involved sending sound waves into the ground and then recording their reflections.
It turns out autocorrelation is also good for detecting pitch in music as well. Hildebrand, who had taken some music classes, recognized an opportunity to improve the quality of music. He introduced Auto-Tune to the industry. And the rest is history.
In this case, knowledge from one industry – oil exploration – was applied to an entirely different field – music. The cognitive diversity was a conscious application of expertise from one realm to another.
While the most natural human tendency is to depend on those we know with expertise in a given, the preceding examples show the value of getting fresh perspectives. When everyone “knows what we know”, it’s time to expand your options.
In the San Francisco Bay Area, home prices have seen significant appreciation the last few years:
Source: Paragon Real Estate Group
In the Bay Area, skyrocketing home prices and rents have driven people out of the area. They look for homes in further-out suburbs and exurbs, extending their commutes to work. And the Bay Area leads the nation in the percentage of people who are mega-commuters (pdf). If you’re raising a family, you accept that long commutes (e.g. hour or more) are the price you pay to have a home for your children.
It’s frankly worrying the way prices continue to rise and people are being pushed out further and further from the employment centers of the Bay Area. Similar types of scenarios are playing out in New York City, Washington D.C., Los Angeles, Chicago, etc. It causes a rising level of stress for working parents, trying to excel both at work and at raising their children.
The general response has been a call for the creation of more affordable housing. Which is a very desirable objective, and needs to be pursued. There is no other near-term relief.
Once you’re freed from having to drive, having to pay attention to the road, you’re afforded new options. Participate in conference calls. Respond to emails. Write documents. Prepare presentations. Run the numbers. Access files in the corporate drive. Engage in conversations. Read reports. Update project plans. Etcetera, etcetera, etc…
As Bay Area companies compete for workers, I expect that they will recognize the challenge of the housing market. Rather than continue to pay escalating salaries so people can afford to live in San Francisco, Santa Clara, Palo Alto, etc., companies will try a different approach. Hire people who live much further out.
See the map below, outlining Northern California median home prices:
Let’s take Roseville, CA as an example. Roseville is 106 miles away from San Francisco, with at least a two-hour commute. And look at the home price difference. You can buy a typical home in Roseville for nearly $700,000 less than what it costs in San Francisco. Per Chase Bank’s mortgage calculator, one can afford a house in Roseville with $100,000 in household income. In San Francisco, you need a household income of $266,400.
Look at that from a Bay Area employer’s perspective. You can spend a lot less on workers who live further out. Of course, that comes at a cost in terms of worker productivity. Or does it?
Let’s assume companies get wise to the benefits of hiring people who live far away from the office. You can imagine a worker’s daily schedule looking something like this.
Such a schedule would provide for:
Productive work time during expected work hours
In-person face time at the office
Parenting time
More money in the employee’s bank account
Less money spent on compensation by employers
Self-driving cars are really the enabling technology for this schedule. We can look at the much discussed Google Buses for some insight. On Quora, Google employee Mary Xu says she uses the bus commute to Mountain View as productive work time. Which validates the possibilities here. However, in a discussion forum about Google Buses, user gnomatic notes that the shared resource of the bus does restrict worker productivity. Wifi can be overtaxed, and phone calls are considered bad etiquette. Which means that individual vehicles are better for realizing the worker productivity.
Self-driving vehicles will radically change the game for us in the decades ahead, a point made also by Reid Hoffman in a terrific post. I fully expect the nature of where we live and work to be altered by autonomous vehicles.
The lean startup movement was developed to address an issue that bedeviled many entrepreneurs: how to introduce something new without blowing all your capital and time on the wrong offering. The premise is that someone has a vision for a new thing, and needs to iteratively test that vision (“fail fast”) to find product-market fit. It’s been a success as an innovation theory, and has penetrated the corporate world as well.
In a recent post, Mike Boysen takes issue with the fail fast approach. He argues that better understanding of customers’ jobs-to-be-done (i.e. what someone is trying to get done, regardless of solutions are used) at the front-end is superior to guessing continuously about whether something will be adopted by the market. To quote:
How many hypotheses does it take until you get it right? Is there any guarantee that you started in the right Universe? Can you quantify the value of your idea?
How many times does it take to win the lottery?
Mike advocates for organizations to invest more time at the front end understanding their customers’ jobs-to-be-done rather than iteratively guessing. I agree with him in principle. However, in my work with enterprises, I know that such an approach is a long way off as a standard course of action. There’s the Ideal vs. the Reality:
The top process – Ideal – shows the right point to understand your target market’s jobs-to-be-done. It’s similar to what Strategyn’s Tony Ulwick outlines for outcome-driven innovation. In the Ideal flow, proper analysis has uncovered opportunities for underserved jobs-to-be-done. You then ideate ways to address the underserved outcomes. Finally, a develop-test-learn approach is valuable for identifying an optimal way to deliver the product or service.
However, here’s the Reality: most companies aren’t doing that. They don’t invest time in ongoing research to understand the jobs-to-be-done. Instead, ideas are generated in multiple ways. The bottom flow marked Reality highlights a process with more structure than most organizations actually have. Whether an organization follows all processes or not, the key is this: ideas are being generated continuously from a number of courses divorced from deep knowledge of jobs-to-be-done.
Inside-out analysis
In my experience working with large organizations, I’ve noticed that ideas tend to go through what I call “inside-out” analysis. Ideas are evaluated first on criteria that reflect the company’s own internal concerns. What’s important to us inside these four walls? Examples of such criteria:
Fits current plans?
Feasible with current assets?
Addresses key company goal?
Financials pencil out?
Leverages core competencies?
For operational, low level ideas inside-out analysis can work. Most of the decision parameters are knowable and the impact of a poor decision can be reversed. But as the scope of the idea increases, it’s insufficient to rely on inside-out analysis.
False positives, false negatives
Starting with the organization’s own needs first leads to two types of errors:
False positive: the idea matches the internal needs of the organization, with flying colors. That creates a too-quick mindset of ‘yes’ without understanding the customer perspective. This opens the door for bad ideas to be greenlighted.
False negative: the idea falls short on the internal criteria, or even more likely, on someone’s personal agenda. It never gets a fair hearing in terms of whether the market would value it. The idea is rejected prematurely.
In both cases, the lack of perspective about the idea’s intended beneficiaries leads to innovation errors. False positives are part of a generally rosy view about innovation. It’s good to try things out, it’s how we find our way forward. But it isn’t necessarily an objective of companies to spend money in such a pursuit. Mitigating the risk of investing limited resources in the wrong ideas is important.
In the realm of corporate innovation, false negatives are the bigger sin. They are the missed opportunities. The cases where someone actually had a bead on the future, but was snuffed out by entrenched executives, sclerotic processes or heavy-handed evaluations. Kodak, a legendary company sunk by the digital revolution, actually invented the digital camera in the 1970s. As the inventor, Steven Sasson, related to the New York Times:
“My prototype was big as a toaster, but the technical people loved it,” Mr. Sasson said. “But it was filmless photography, so management’s reaction was, ‘that’s cute — but don’t tell anyone about it.’ ”
It’s debatable whether the world was ready for digital photography at the time, as there was not yet much in the way of supporting infrastructure. But Kodak’s inside-out analysis focused on its effect on their core film business. And thus a promising idea was killed.
Start with outside-in analysis
Thus organizations find themselves with a gap in the innovation process. In the ideal world, rigor is brought to understanding the jobs-to-be-done opportunities at the front-end. In reality, much of innovation is generated without analysis of customers’ jobs beforehand. People will always continue to propose and to try out ideas on their own. Unfortunately, the easiest, most available basis of understanding the idea’s potential starts with an inside-out analysis. The gap falls between those few companies that invest in understanding customers’ jobs-to-be-done, and the majority who go right to inside-out analysis.
What’s needed is a way to bring the customers’ perspective into the process much earlier. Get that outside-in look quickly.
Three jobs-to-be-done tests
In my work with large organizations, I have been advising a switch in the process of evaluating ideas. The initial assessment of an idea should be outside-in focused. Specifically, there are three tests that any idea beyond the internal incremental level should pass:
Each of the tests examines a critical part of the decision chain for customers.
Targets real job of enough people
The first test is actually two tests:
Do people actually have the job-to-be-done that the idea intends to address?
Are there enough of these people?
This is the simplest, most basic test. Most ideas should pass this, but not all. As written here previously, the Color app was developed to allow anyone – strangers, friends – within a short range to share pictures taken at a location. While a novel application of the Social Local Mobile (SoLoMo) trends, Color actually didn’t address a job-to-be-done of enough people.
A lot better than current solution
Assuming a real job-to-be-done, consideration must next be given to the incumbent solution used by the target customers. On what points does the proposed idea better satisfy the job-to-be-done than what is being done today? This should be a clear analysis. The improvement doesn’t have to be purely functional. It may better satisfy emotional needs. The key is that there is a clear understanding of how the proposed idea is better.
And not just a little better. It needs to be materially better to overcome people’s natural conservatism. Nobel Laureate Daniel Kahneman discusses two factors that drive this conservatism in his book, Thinking, Fast and Slow:
Endowment effect: We overvalue something we have currently over something we could get. Think of that old saying, “a bird in the hand is worth two in the bush”.
Uncertainty effect: Our bias shifts toward loss aversion when we consider how certain the touted benefits of something new are. The chance that something doesn’t live up to its potential looms larger in our psyche, and our aversion to loss causes to overweight the probability that something won’t live up to its potential.
In innovation, the rule-of-thumb that something needs to be ten times better than what it would replace reflects our inherent conservatism. I’ve argued that the problem with bitcoin is that it fails to substantially improve our current solutions to payments: government-issued currency.
Value exceeds cost to beneficiary
The final test is the most challenging. It requires you to walk in the shoes of your intended beneficiaries (e.g. customers). It’s an analysis of marginal benefits and costs:
Value of improvement over current solution > Incremental costs of adopting your new idea
Not the costs of the company to provide the idea, but those that are borne by the customer. These costs include monetary, learning processes, connections to other solutions, loss of existing data, etc. It’s a holistic look at tangible and intangible costs. Which admittedly, is the hardest analysis to do.
An example where the incremental costs didn’t cover the improvements is of a tire that Michelin introduced in the 1990s. The tire had a sensor and could run for 125 miles after being punctured. A sensor in the car would let the driver know about the issue. But for drivers, a daunting issue emerged: how do you get those tires fixed/replaced? They required special equipment that garages didn’t have and weren’t going to purchase. The costs of these superior tires did not outweigh the costs of not being able to get them fixed/replaced.
Recognize your points of uncertainty
While I present the three jobs-to-be-done tests as a sequential flow of yes/no decisions, in reality they are better utilized as measures of uncertainty. Think of them as gauges:
Treat innovation as a learning activity. Develop an understanding for what’s needed to get to ‘yes’ for each of the tests. This approach is consistent with the lean startup philosophy. It provides guidance to the development of a promising idea.
Mike Boysen makes the fundamental point about understanding customers’ jobs-to-be-done to drive innovation. Use these three tests for those times when you cannot invest the time/resources at the front end to understand the opportunities.
Venture capitalist Marc Andreessen recently did one of his tweetstorms on the topic of Bitcoin, a technology he avidly supports. In 25 tweets, he talked about criticisms people have of Bitcoin. Including this one (#18) about “use cases”:
18/The third critique I call the “innocent” one — “Are there enough sufficiently compelling uses cases for Bitcoin to succeed at scale?”
Let’s acknowledge this: When you’re talking currency and payment systems, the use cases and relevant users are enormous. The whole planet, really, and all manner of transactions. Lots of places where Bitcoin could theoretically make an impact. In this post, I wanted to think through the consumer payment market, one of the bigger targets there is. According to the Federal Reserve, a U.S. consumer makes around 69 payments per month (pdf). Fertile ground for exploiting underserved jobs-to-be-done.
A powerful way to analyze any idea is to apply jobs-to-be-done analysis. Specifically, apply three jobs-to-be-done tests:
Does the idea target an actual job-to-be-done that enough people have?
Is the idea a meaningful improvement over the current way people fulfill their job-to-be-done?
Does the value of the idea to customers exceed the cost of the idea to them?
In the above linked post about the three tests, I note that the output of the tests are really degrees of certainty about an idea. You can think of it as meters:
The more uncertain you are, the higher the adoption risk of the idea by your intended beneficiaries.
For this analysis, we’ll target a specific set of possible beneficiaries:
Bitcoin will become a frequently used currency for U.S. and European consumers, displacing dollars, euros and pounds.
Ok, on to the adoption analysis. Each test includes an assessment of its certainty.
#1: Targets and actual job-to-be-done of enough people
We long ago left barter behind as a primary basis for goods and services exchange. Currency offered many advantages: a way to exchange with you now, even if I don’t have a good you want; store of value of that outlasts many goods; ability to build up a supply of currency for larger purchases; immediate trust because the currency is known, as opposed to the risk of a receiving a deficient product in trade.
Currency won out over barter for many reasons. And to that end, Bitcoin addresses an actual job-to-be-done: a measure of value that can be exchanged for goods and services.
The level of certainty for this test:
Targets actual job-to-be-done
of enough people
#2: Better than current solution
Any new thing has to provide better outcomes than the incumbent solution. And not just a little better. Studies show people will undervalue the benefits of a new offering, and overvalue the benefits of an existing solution. This reflects the varying degrees of the Possibility Effect and the Uncertainty Effect people have. Providing a strong improvement in outcomes is needed to overcome the inertia of the Early and Late Majorities.
Put yourself into the shoes of a typical consumer:
I need to pay for groceries
I need to pay for my Amazon purchases
I need to pay for school tuition
I need to pay for gas
I need to pay for rent
All these activities happen today with dollars, euros, pounds and so on. In what way does paying by Bitcoin provide better outcomes for my payment needs than the currency I use today? Among the Bitcoin improvements I’ve seen described:
Payment cannot be repudiated: The blockchain technology locks in the transmittal of the payment. There’s a full record of payment offered, payment accepted. Which is great as a record for the transaction. Except repudiation isn’t a material issue for consumers for today. They by and large don’t feel pain from it.
No centralized government control over the currency: Bitcoin is a distributed currency, with no central authority overseeing and manipulating it. The implied value is that issues like devaluation, inflation and governments tracking your spending are finally put to rest.
But stop and think about that. Who cares about these issues? Go find 10 neighbors. Ask them their level of concern that the money in their wallet is managed by a central authority. Find out what they think about the traceability of their spending. Many payment services companies actually offer traceability as a feature, not a bug (e.g. Mint, Yodlee, American Express, etc.). I haven’t heard much outcry about payment traceability among the general public.
Reduced identity theft fraud: Credit card numbers can be stolen and used by thieves. Marc Andreessen asserts that Bitcoin greatly reduces this risk. And I suspect he’s right, as far as we understand the risks today. But already, creative thieves are figuring out ways to steal Bitcoins. Innovation at its finest.
But getting better about reducing identity theft is a clear opportunity for better outcomes. Credit card companies have become quite advanced with this via big data algorithms, which spot out-of-norm transactions and flag them. Companies are also good at covering the losses resulting from payment identity theft.
Because Bitcoin is still experiencing losses due to fraud, it’s not clear in consumers’ minds that it’s less risky than current currency and payment methods.
The level of certainty for this test:
Meaningful improvement over
the current way people fulfill
the job-to-be-done
#3: Value to consumers exceeds costs of new idea
In this test, you’re asked to look holistically at the costs of a new idea. Monetary costs, yes. But also other costs, such as:
Connecting the new solution to existing infrastructure
Loss of features you enjoy in current solution
Giving up the uncertainty of the current solution
New unwanted behaviors
Given the low (non-existent?) value of Bitcoin over current currencies, pretty much any cost will cause a high level of uncertainty for this test.
And Bitcoin has costs. Its current volatility makes it tough to rely on a consistent store of value. You receive $10,000 worth of Bitcoin today, what will that be worth in a month? There’s a learning curve for usage. You need to know how to operate a Bitcoin account, and retrain yourself to think in terms of Bitcoin values (like when you travel abroad and have to mentally calculate the local currency price into your home currency to understand what something really costs).
To the extent that economic cycles will inevitably continue, you need to get used to no central authority intervening to help stabilize things. It’s not clear what a Bitcoin-dominated world would look like in terms of economic stability. Likely, though, this uncertainty doesn’t weigh into consumers’ calculus of costs.
The level of certainty for this test:
Value to consumers exceeds
the cost of the new solution
Wrapping up
It’s hard to see how Bitcoin becomes a regular currency used by consumers. It doesn’t offer sufficient improvement over incumbent currencies and the cost is hard to overcome with any potential value. One possibility: if the lower fraud rates associated with Bitcoin are reliable, perhaps merchants will offer discounts for use of them. That could spur some people to switch to Bitcoins.
The bigger story of Bitcoin is actually the blockchain technology. The ability to ascertain easily, without an intermediary, that a transaction (e.g. document signing, receipt of something, etc.) has occurred seems to offer tangible value over current solutions. That may be Bitcoin’s true legacy.
The area of collaborative innovation is a natural extension of the social business movement. It’s the extension of social into purposeful collaboration, a term Alan Lepofsky uses to describe the evolution of the social business market.
In the innovation-focused radio show, Women Who Innovate, host LeAnna Carey, innovation expert John Lewis and I talk about collaborative innovation at scale. In other words, what are the benefits of, issues with, and techniques for getting hundreds and thousands of people to share ideas and insights, toward a common goal. It’s a different task than getting small teams to collaborate. The recording of the show is below:
This event had a unique twist. It was run in conjunction with the weekly innovation conversation on Twitter, Innochat. In both the radio show on on Twitter, the following topics were covered:
How important is it to get diverse people to contribute to innovation, vs. singular creatives to generate innovations?
Doesn’t Steve Jobs point to the primacy of singular genius?
What is the model for cognitive diversity to generate innovation outcomes?
What differentiates sharing in large groups vs. small teams?
How much does familiarity mean trust?
How to handle different personalities that will intersect?
In environments where employee skepticism reigns, how do you change attitudes to open up sharing?
What are the ways in which skepticism can creep in?
What is the #1 issue that must be addressed?
What are motivations for employees to contribute to an innovation program?
How much does “what’s in it for me?” come into play?
What are the intrinsic and extrinsic motivations?
What techniques help drive participation in crowdsourced innovation programs?
What influence do senior executives have?
What influence does peer participation have?
How can gamification drive greater participation?
It was a thorough, fast-paced discussion. If you’re considering crowdsourced innovation programs, it’s worth a listen.
Previously, I’ve described Why Crowdsourcing Works. Crowdsourcing is a case where you get many people who don’t one another collaborating toward a defined outcome.To reiterate the principle points about the value of crowdsourcing:
Diverse inputs drive superior solutions
Cognitive diversity requires spanning gaps in social networks
Simple enough, yet actually a rich field for work and analysis. To that end, I invite to two events happening simultaneously on Thursday 25 September 2014 (12 noon Eastern):
I’ll be on the radio show talking with Lea Carey, Renee Hopkins and John Lewis. At the same time, the weekly #innochat will follow along with the radio program. It’s a unique chance to blend live conversation with online discussion. The main questions to be tackled will be:
How important is it to get diverse people to contribute to innovation, vs. singular creatives to generate innovations?
Doesn’t Steve Jobs point to the primacy of singular genius?
What is the model for cognitive diversity to generate innovation outcomes?
What differentiates sharing in large groups vs. small teams?
How much does familiarity mean trust?
How to handle different personalities that will intersect?
In environments where employee skepticism reigns, how do you change attitudes to open up sharing?
What are the ways in which skepticism can creep in?
What is the #1 issue that must be addressed?
What are motivations for employees to contribute to an innovation program?
How much does “what’s in it for me?” come into play?
What are the intrinsic and extrinsic motivations?
What techniques help drive participation in crowdsourced innovation programs?
What influence do senior executives have?
What influence does peer participation have?
How can gamification drive greater participation?
As a reminder, the event time across time zones:
Thursday 25 September 2014
9 am Pacific
12 noon Eastern
6 pm Central European Time
I look forward to hearing your take on this issue.
The sharing economy is increasingly in the news. Those six companies are receiving a lot of chatter, as shown by Google News results for September 12, 2014:
Certainly, the sharing economy is a “thing”. But it’s not yet as mainstream as may come across in the media. For most of us, it’s still sort of a “toy” if you will. Cute that people would offer up their home for a weekend or give someone a ride in that empty passenger seat. But as YCombinator’s Paul Graham says:
Don’t be discouraged if what you produce initially is something other people dismiss as a toy. In fact, that’s a good sign.
The sharing economy is in the early adopter phase. Which means it’s going to need some attributes to make the jump to mainstream adoption:
Offering a “whole product” experience, not just satisfying a narrow slide of all needs
A feature-quality-price blend that better satisfies existing jobs-to-be-done than do incumbents
Evidence of value and satisfaction from others they trust (friends, media)
But the upside is terrific when the sharing economy is adopted. That topic is explored more fully in my new post: Harvesting Abundance in the Sharing Economy. It starts with the premise visualized below, and builds on that:
Interested in how we can dramatically increase supply and long tail options? Check out the sharing economy post.
Say you’ve got some internal ideas at your company. Who takes a look at them? Assesses them to determine next steps for each idea? Figures out the value and difference the ideas can make?
How about your own customers?
I talk a lot about jobs-to-be-done here, and getting a firm grip on those to understand where innovation and product enhancement opportunities lie. But sometimes that’s not realistic. Ideas come from many sources, and more likely than not, fail to reflect hard analysis of jobs-to-be-done. But customer feedback is valuable. Any idea which can touch on customers’ experience – products, services, support, pricing, deliver, knowledge – can benefit from their perspectives.
The concept sounds right, yes? But it’s also something that’s somewhat scary. I know this because I asked innovation executives for a number of large companies what they thought of it. There was hesitancy to the concept of bringing customers into what is generally an internal – and often murky at best – process of evaluating ideas.


The Conversation